Spheroid assays are useful because they capture 3D growth, morphology, and treatment response in a format that is closer to tissue-like biology than a flat monolayer. They are also easy to analyse inconsistently. A slight change in thresholding can change diameter, circularity, or whether a loose aggregate is counted as one spheroid or several.
Detect spheroids and quantify morphology
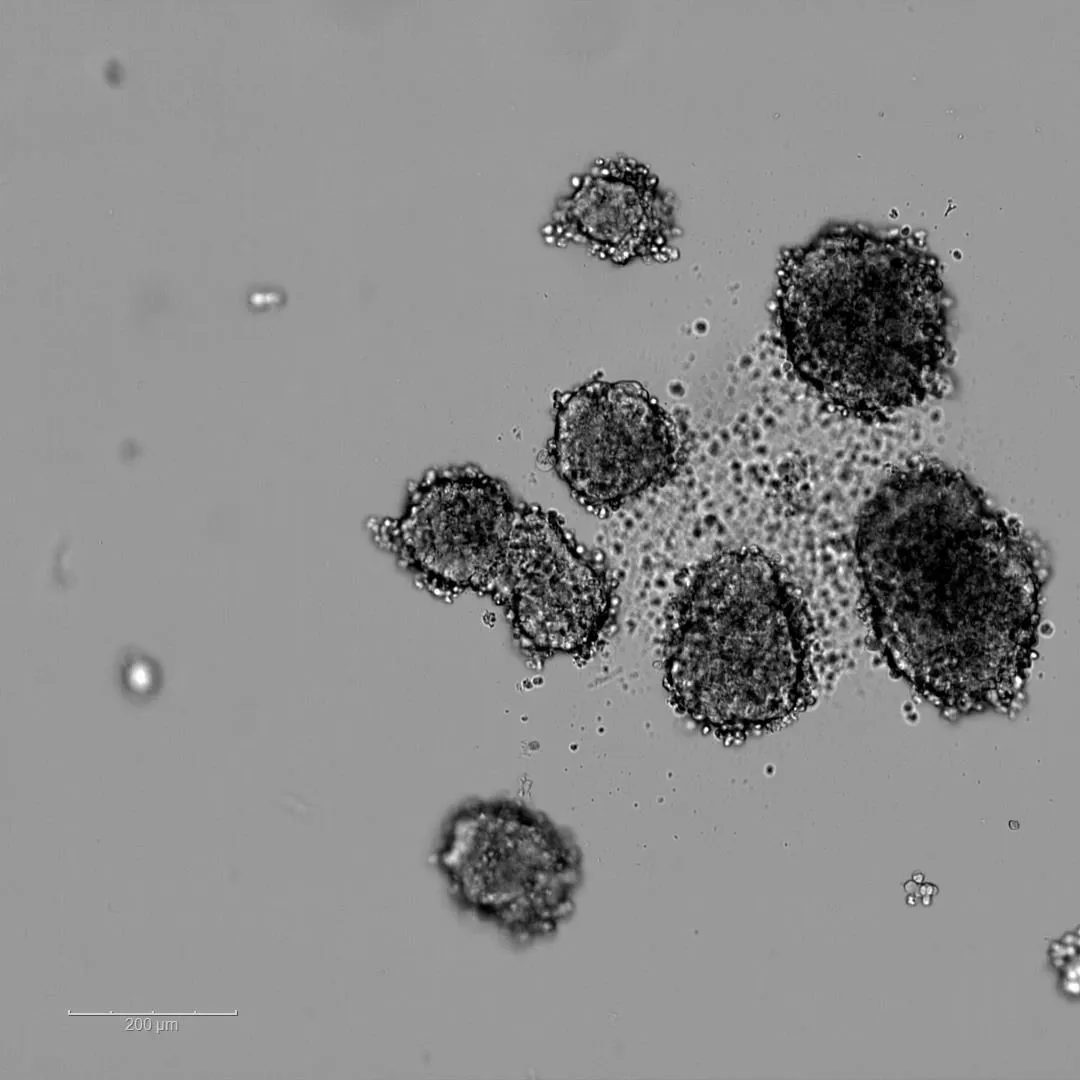
Compare the raw microscopy image with the segmentation used for measurement.
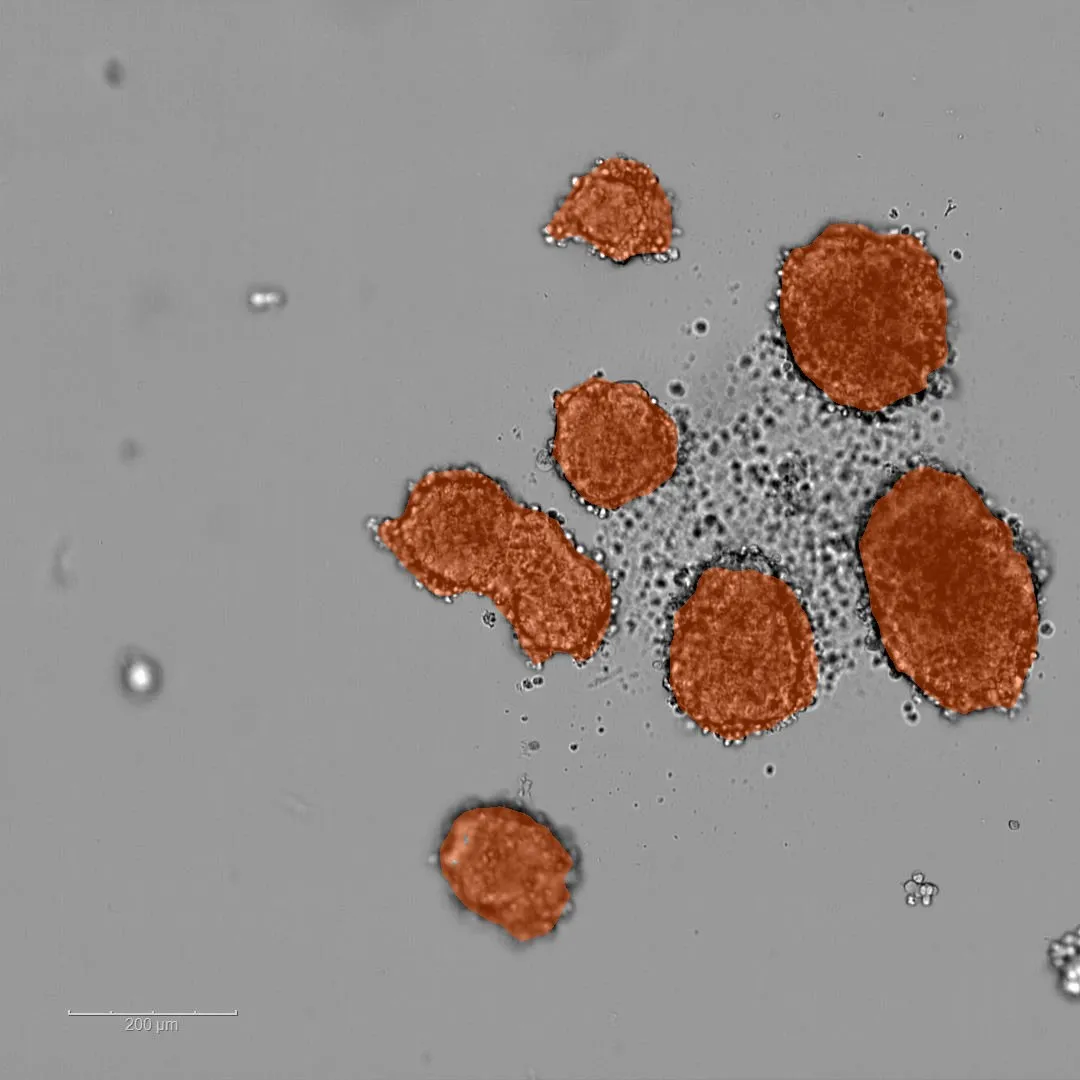 Segmented
Raw
Segmented
Raw
Metrics that matter
For efficacy or toxicity screening, the important output is not only whether a spheroid is present. It is how the morphology changes over concentration and time.
- Spheroid count and diameter
- Circularity and morphology flags
- Time-course growth or shrinkage after treatment
Images worth reviewing
Automated analysis should also point scientists to images that are likely to bias the screen.
- Multiple aggregates touching each other
- Out-of-focus or low-contrast wells
- Fragments that should not be counted as viable spheroids
Screening spheroids across plates?
Use CellOpsis for spheroid image analysis, or talk to us about a custom model if your organoid or aggregate morphology needs assay-specific tuning.
Discuss a spheroid workflow ->