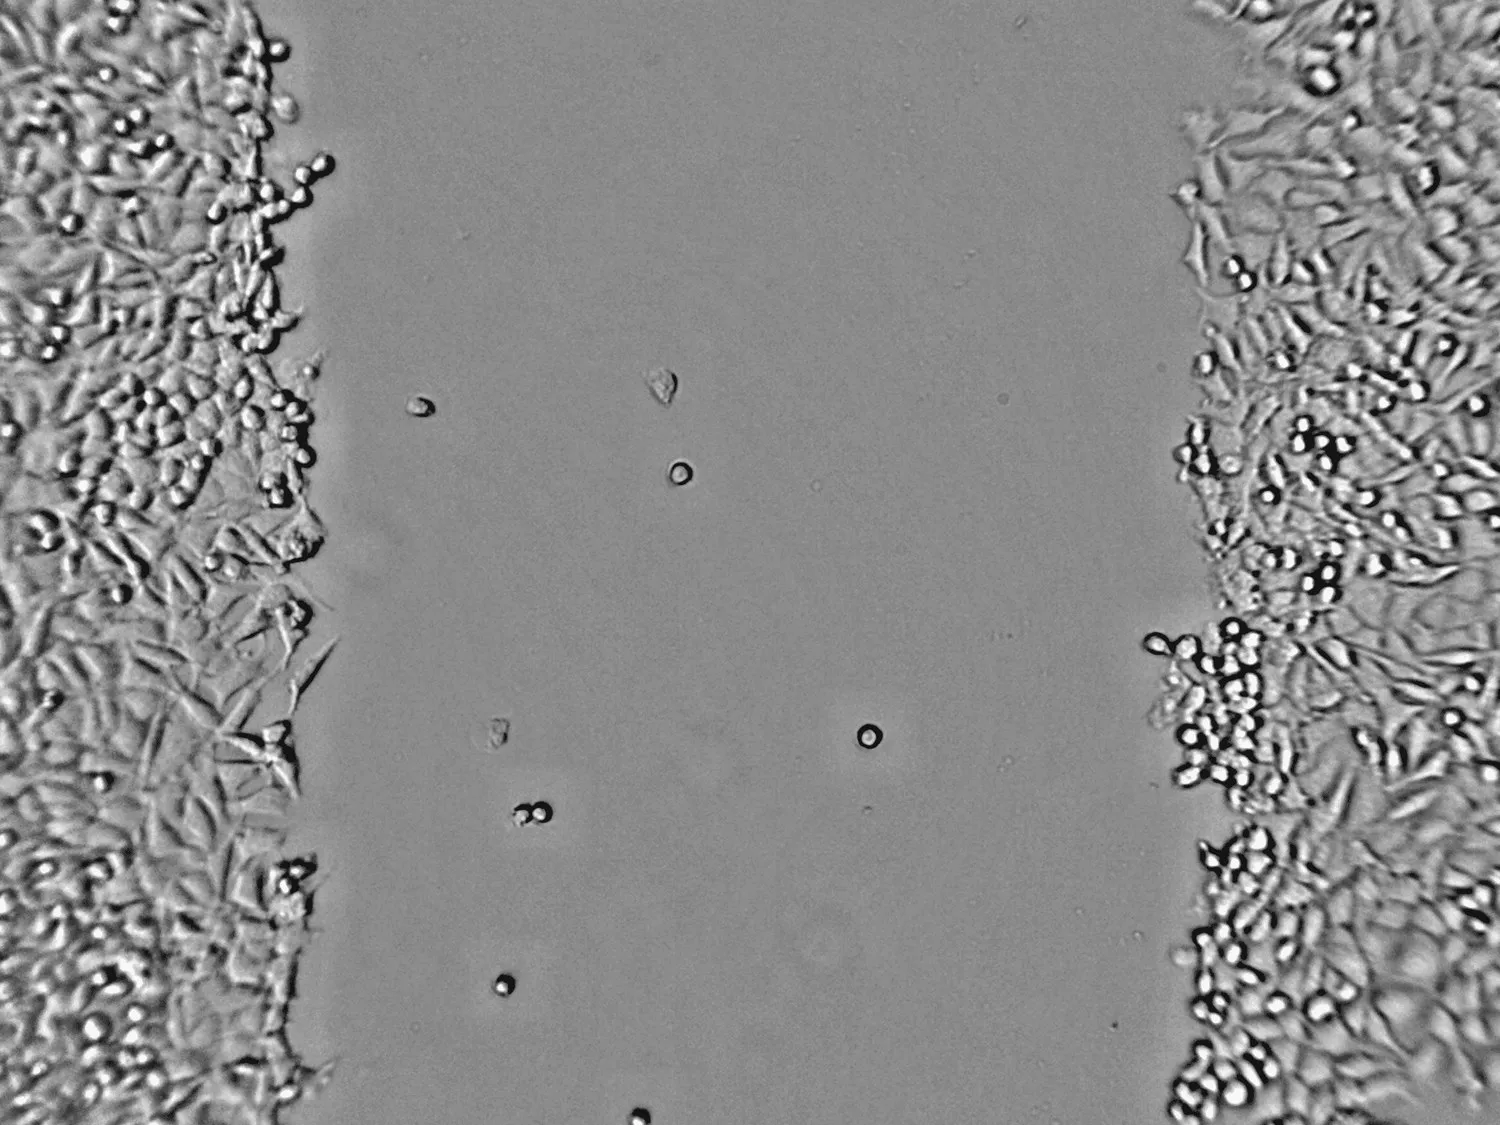
Scratch assays are simple to run but easy to make inconsistent during analysis. Edge detection, debris, uneven illumination, and cell islands inside the wound can all change the measured open area. A useful image-analysis workflow should quantify closure over time and make the questionable images obvious before the graph is trusted.
Measure the wound area, not just the image
Slide to compare the raw scratch assay image with the segmentation output.
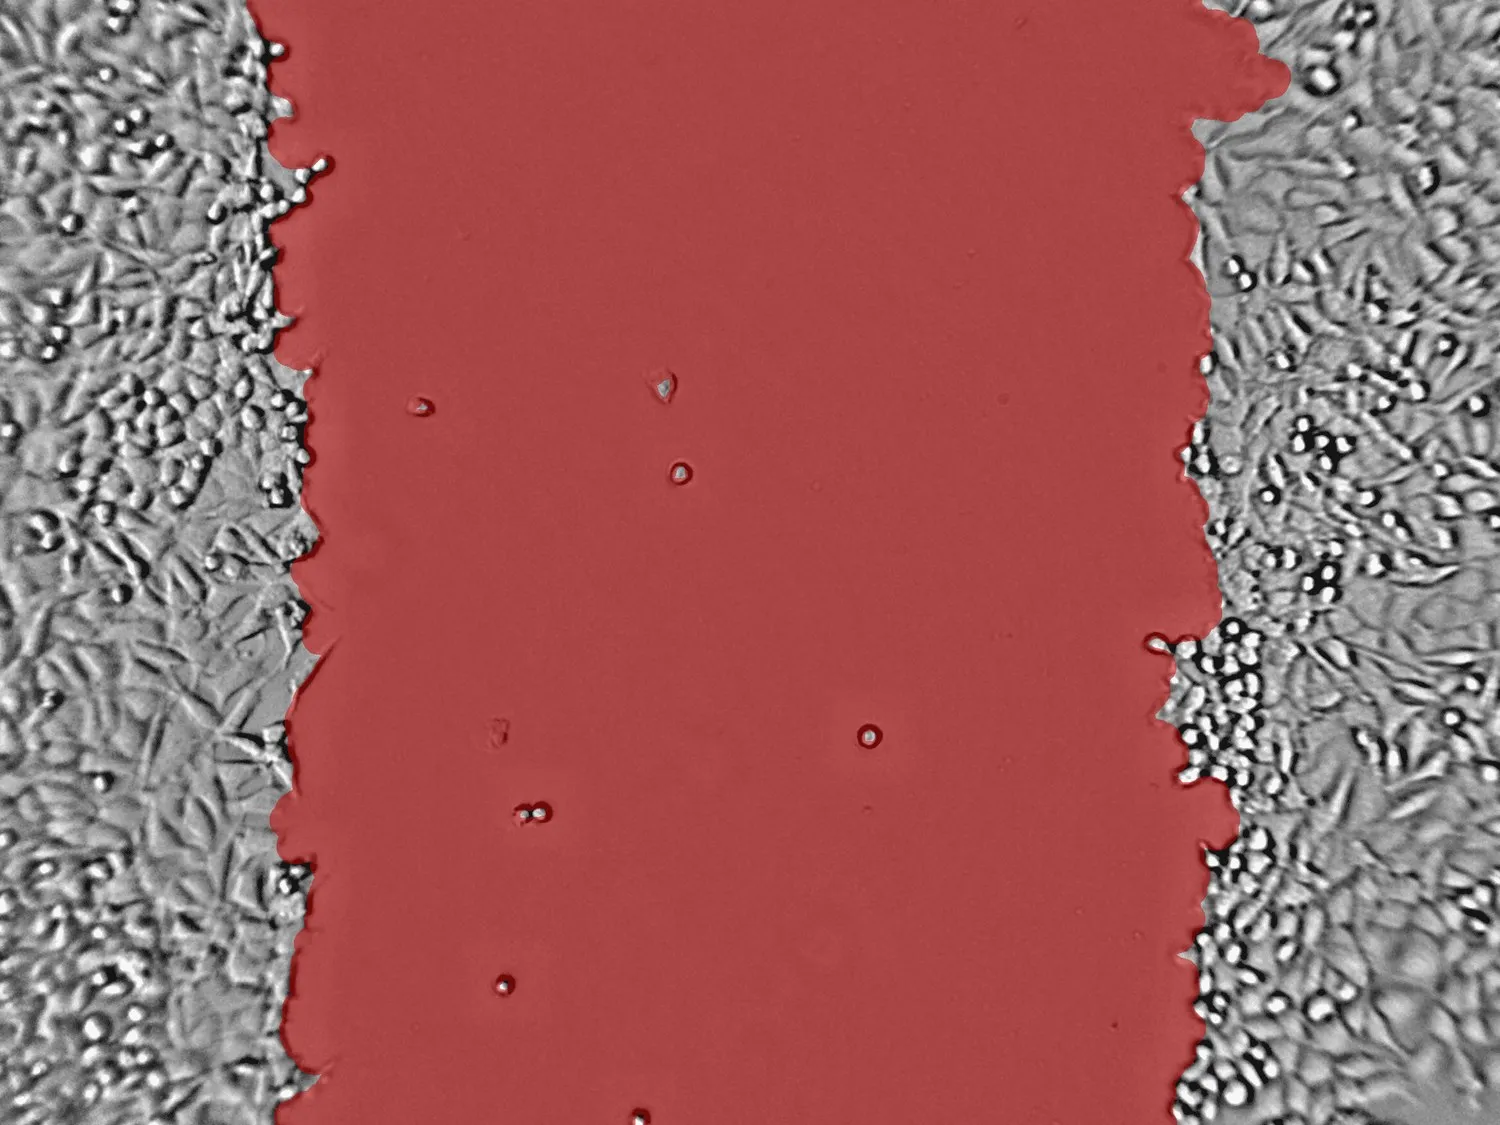 Segmented
Raw
Segmented
Raw
Useful outputs
The goal is not a pretty overlay. The goal is a reproducible time-course measurement that can be compared between conditions.
- Open wound area per image or timepoint
- Percent closure relative to the starting image
- Curve-ready CSV outputs for replicates and treatments
Quality checks to flag
A scratch assay workflow should flag images that need review instead of hiding them in a final average.
- Uneven wound edges or scratches outside the field of view
- Debris, bubbles, or detached cells crossing the gap
- Timepoints captured too far apart for reliable kinetics
Want to test a scratch assay image?
CellOpsis supports scratch/wound assay analysis alongside adherent, suspension, and spheroid culture formats. For unusual assays, see our custom model workflow.
Try CellOpsis ->