Plate-based cell counting becomes painful when every well produces one or more microscopy images. A single 96-well plate can turn into hundreds of files once replicates, fields of view, and timepoints are included. Manual counting, threshold macros, and one-image-at-a-time review do not scale well when the question is simply: which wells changed, and by how much?
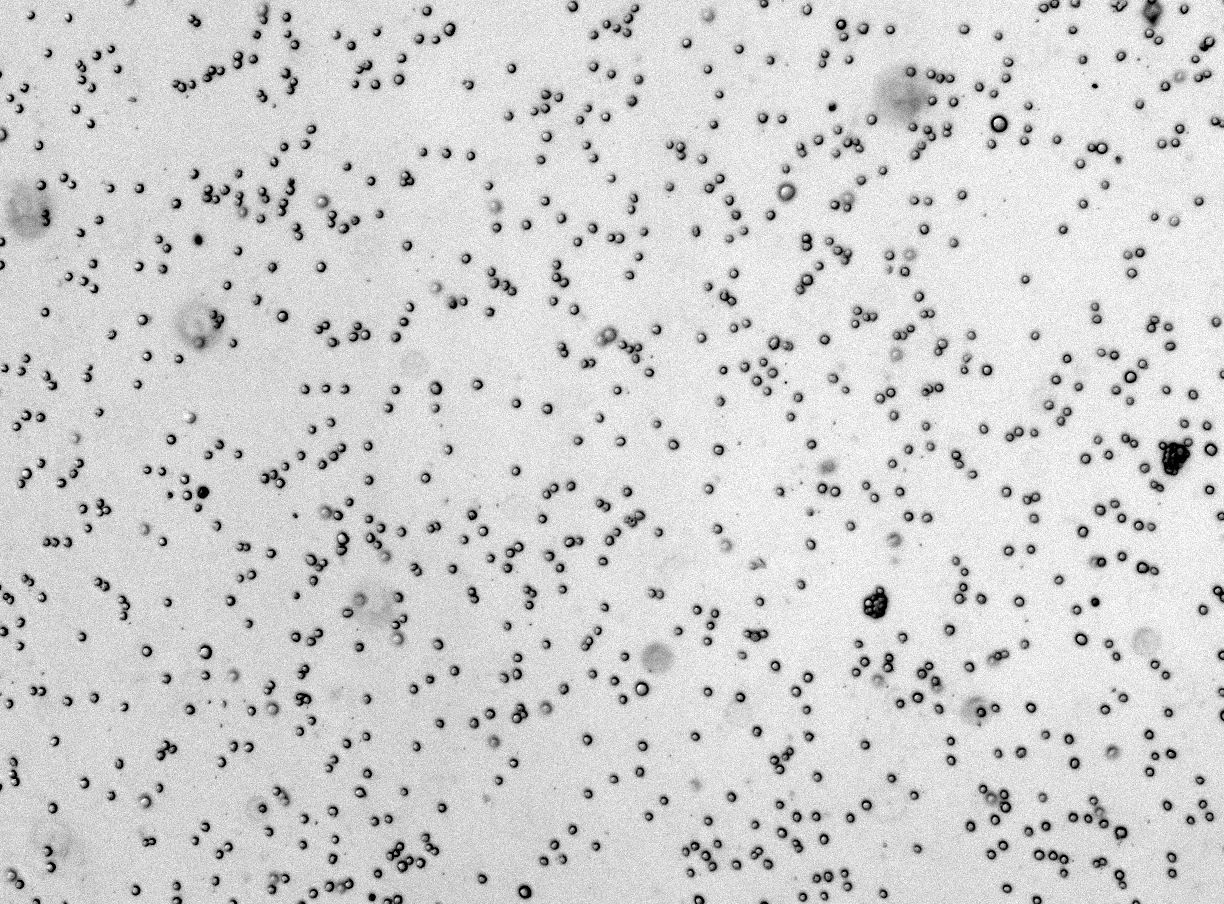
From raw well image to quantified output
Use a consistent workflow for counting, segmentation review, and export across plate images.
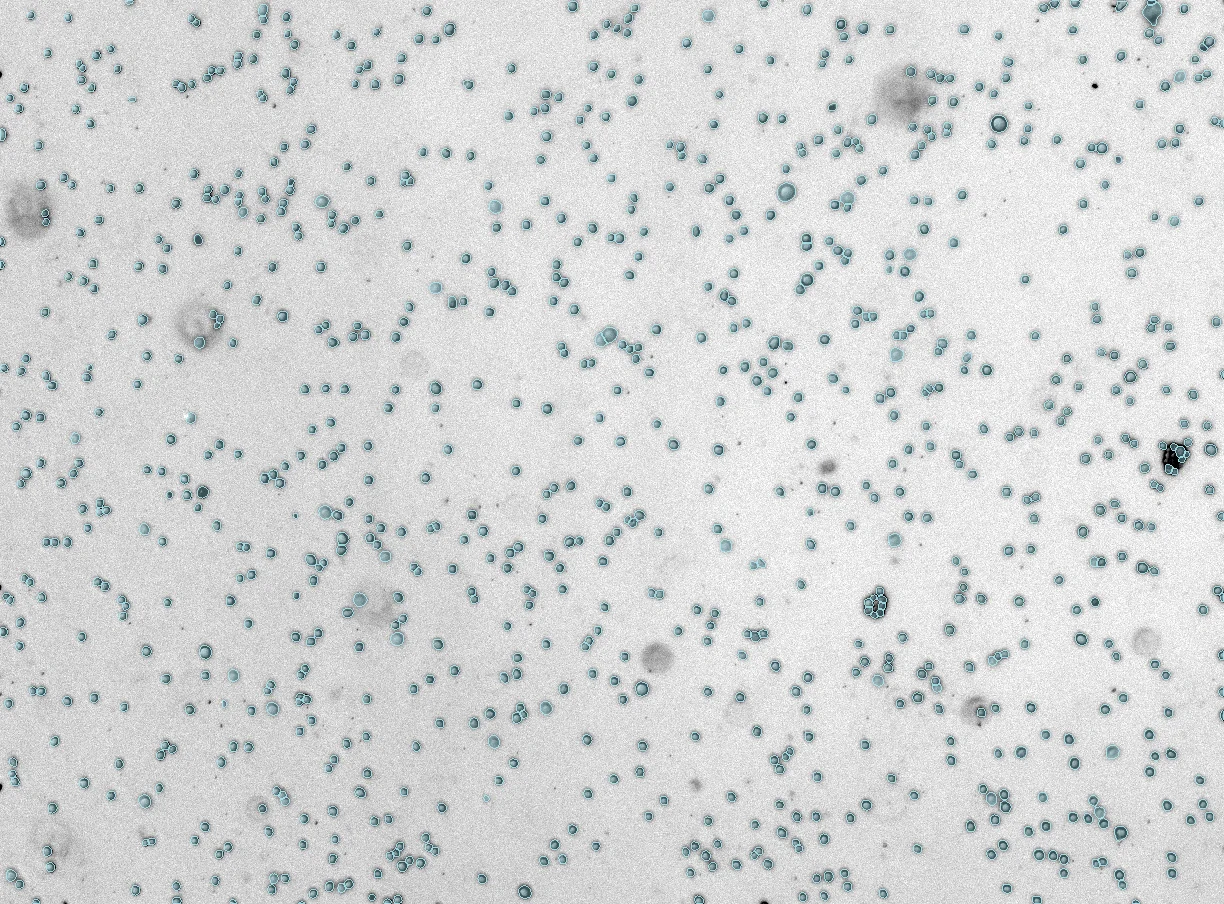 Mask
Raw
Mask
Raw
Where plate analysis breaks down
The bottleneck is rarely image capture alone. It is file handling, repeated threshold tuning, reviewer drift, and reconciling outputs into a clean plate map.
- Large batches from 96-well or 384-well plates
- Different densities across edge wells and treatment groups
- Images that need quality flags before statistical analysis
How CellOpsis helps
CellOpsis is built around browser-based image analysis: upload images, run segmentation and counting, review outputs, and export CSV results that can be joined to plate metadata.
- Counts and masks from microscopy images
- Cloud analysis with no local GPU setup
- Custom models when a lab's plate format needs tuning
Need to analyse a plate image batch?
Start with the CellOpsis Bench application note, or send a representative image set if your plate format needs a custom workflow.
Discuss a plate workflow ->